1.3 Case mortality
1.3.1 World
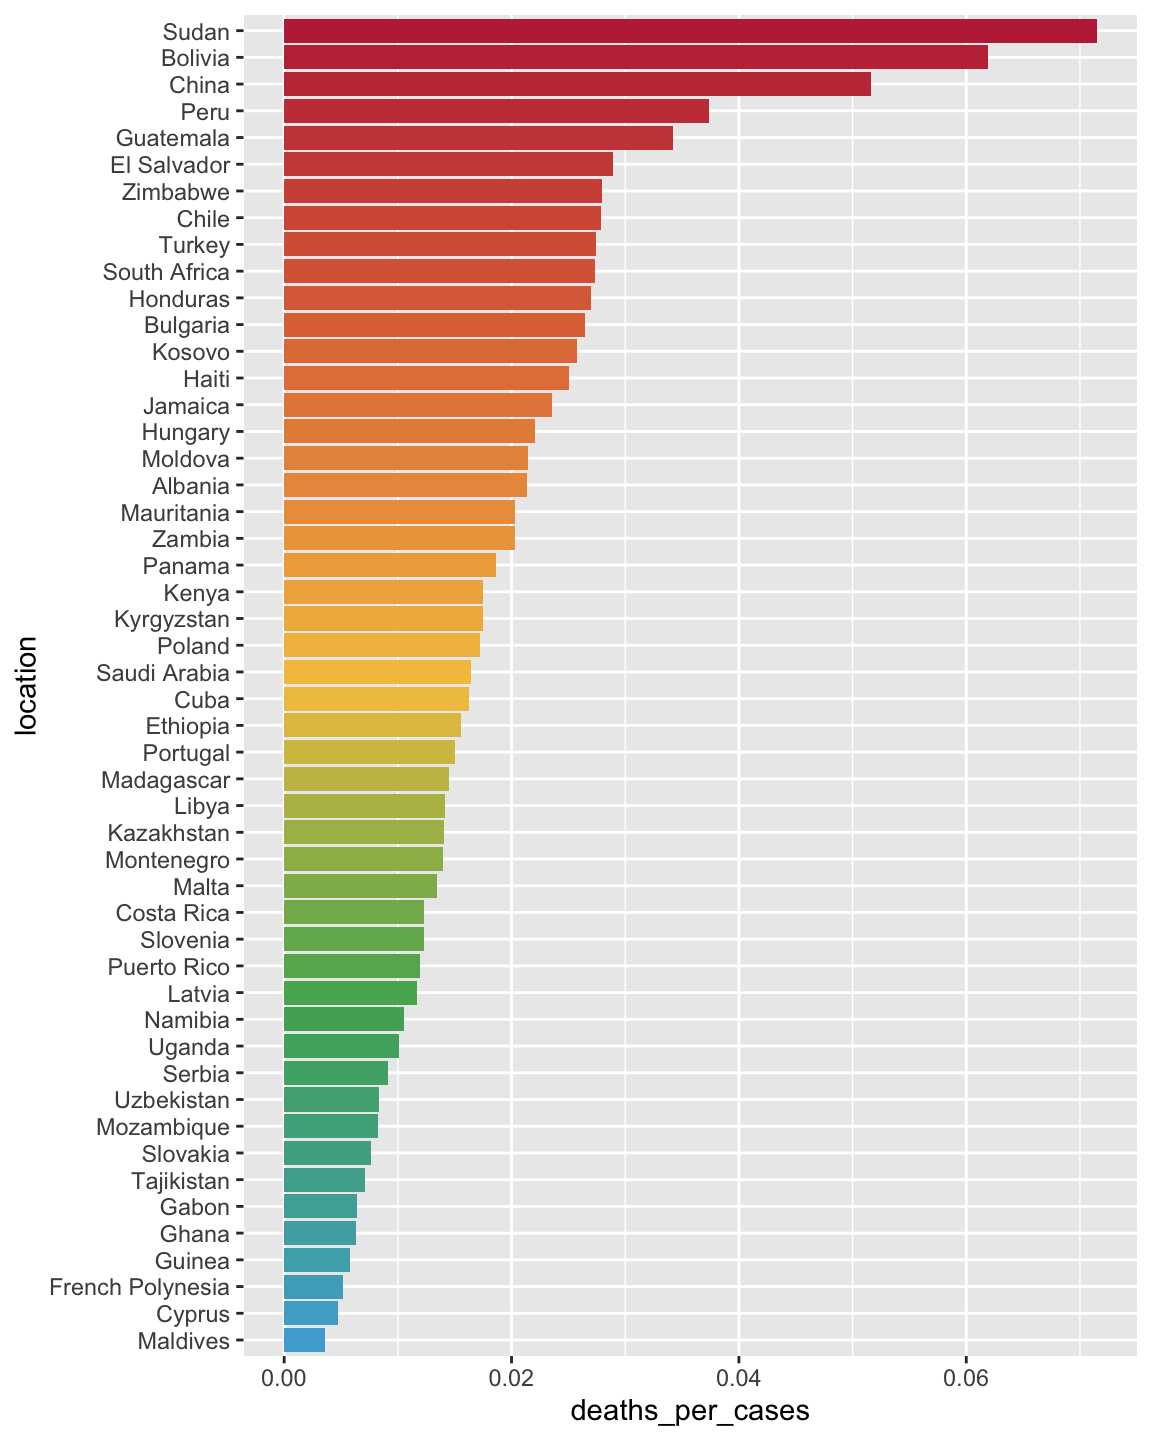
This plot shows the case mortality as number of deaths per cases around the world.
Notes:
The number of reported cases depends on the extend to which a population has been tested. Thus, countries where only severe hospitalized cases are tested will have unrealistically high mortality rates.
For clarity, only the top 50 locations with the highest number of cases are shown.
1.3.2 Germany
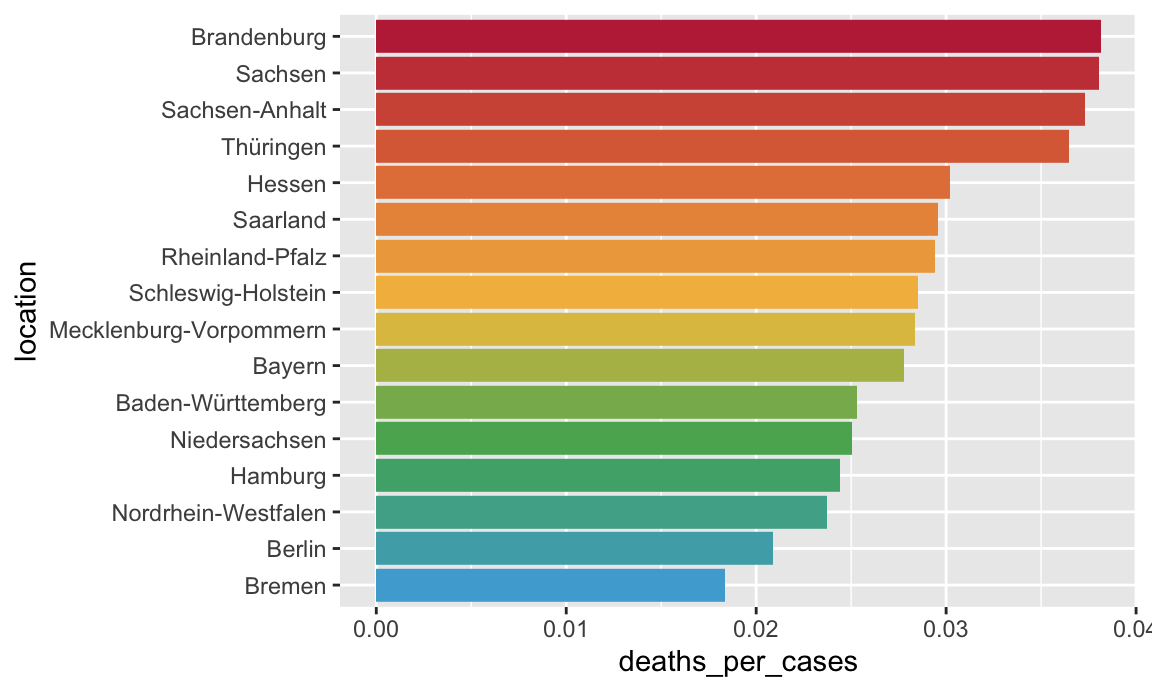
This plot shows the case mortality as number of deaths per cases for Germany.
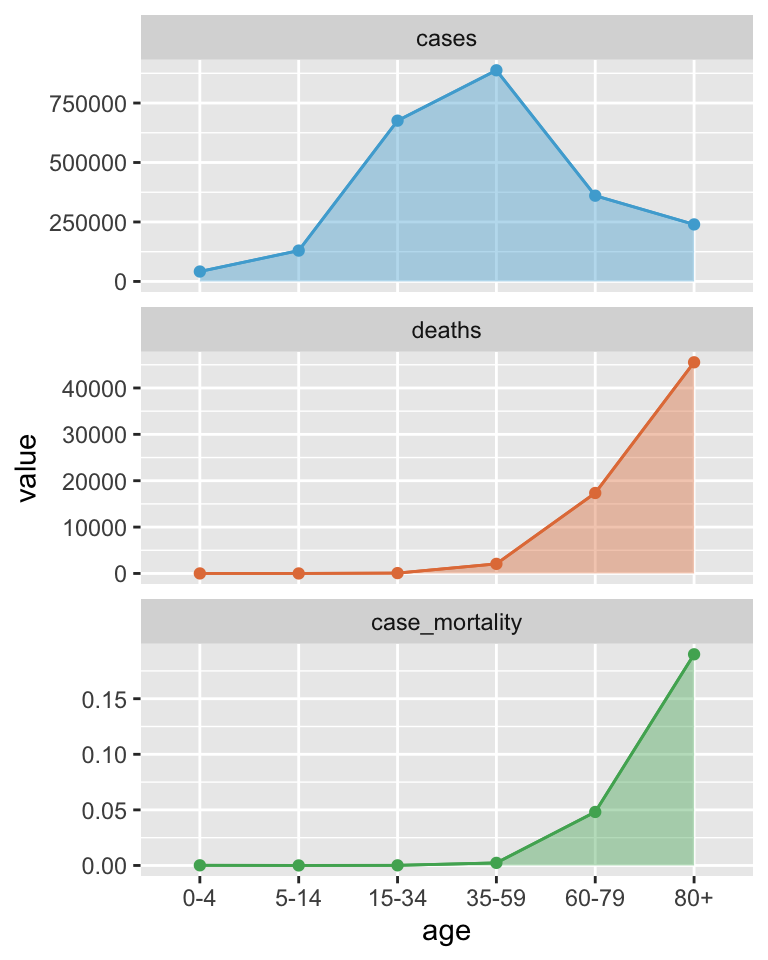
Stratification by age shows a strong association of case mortality with higher age.
This plot summarizes cases, deaths and case_mortality by age.